Information
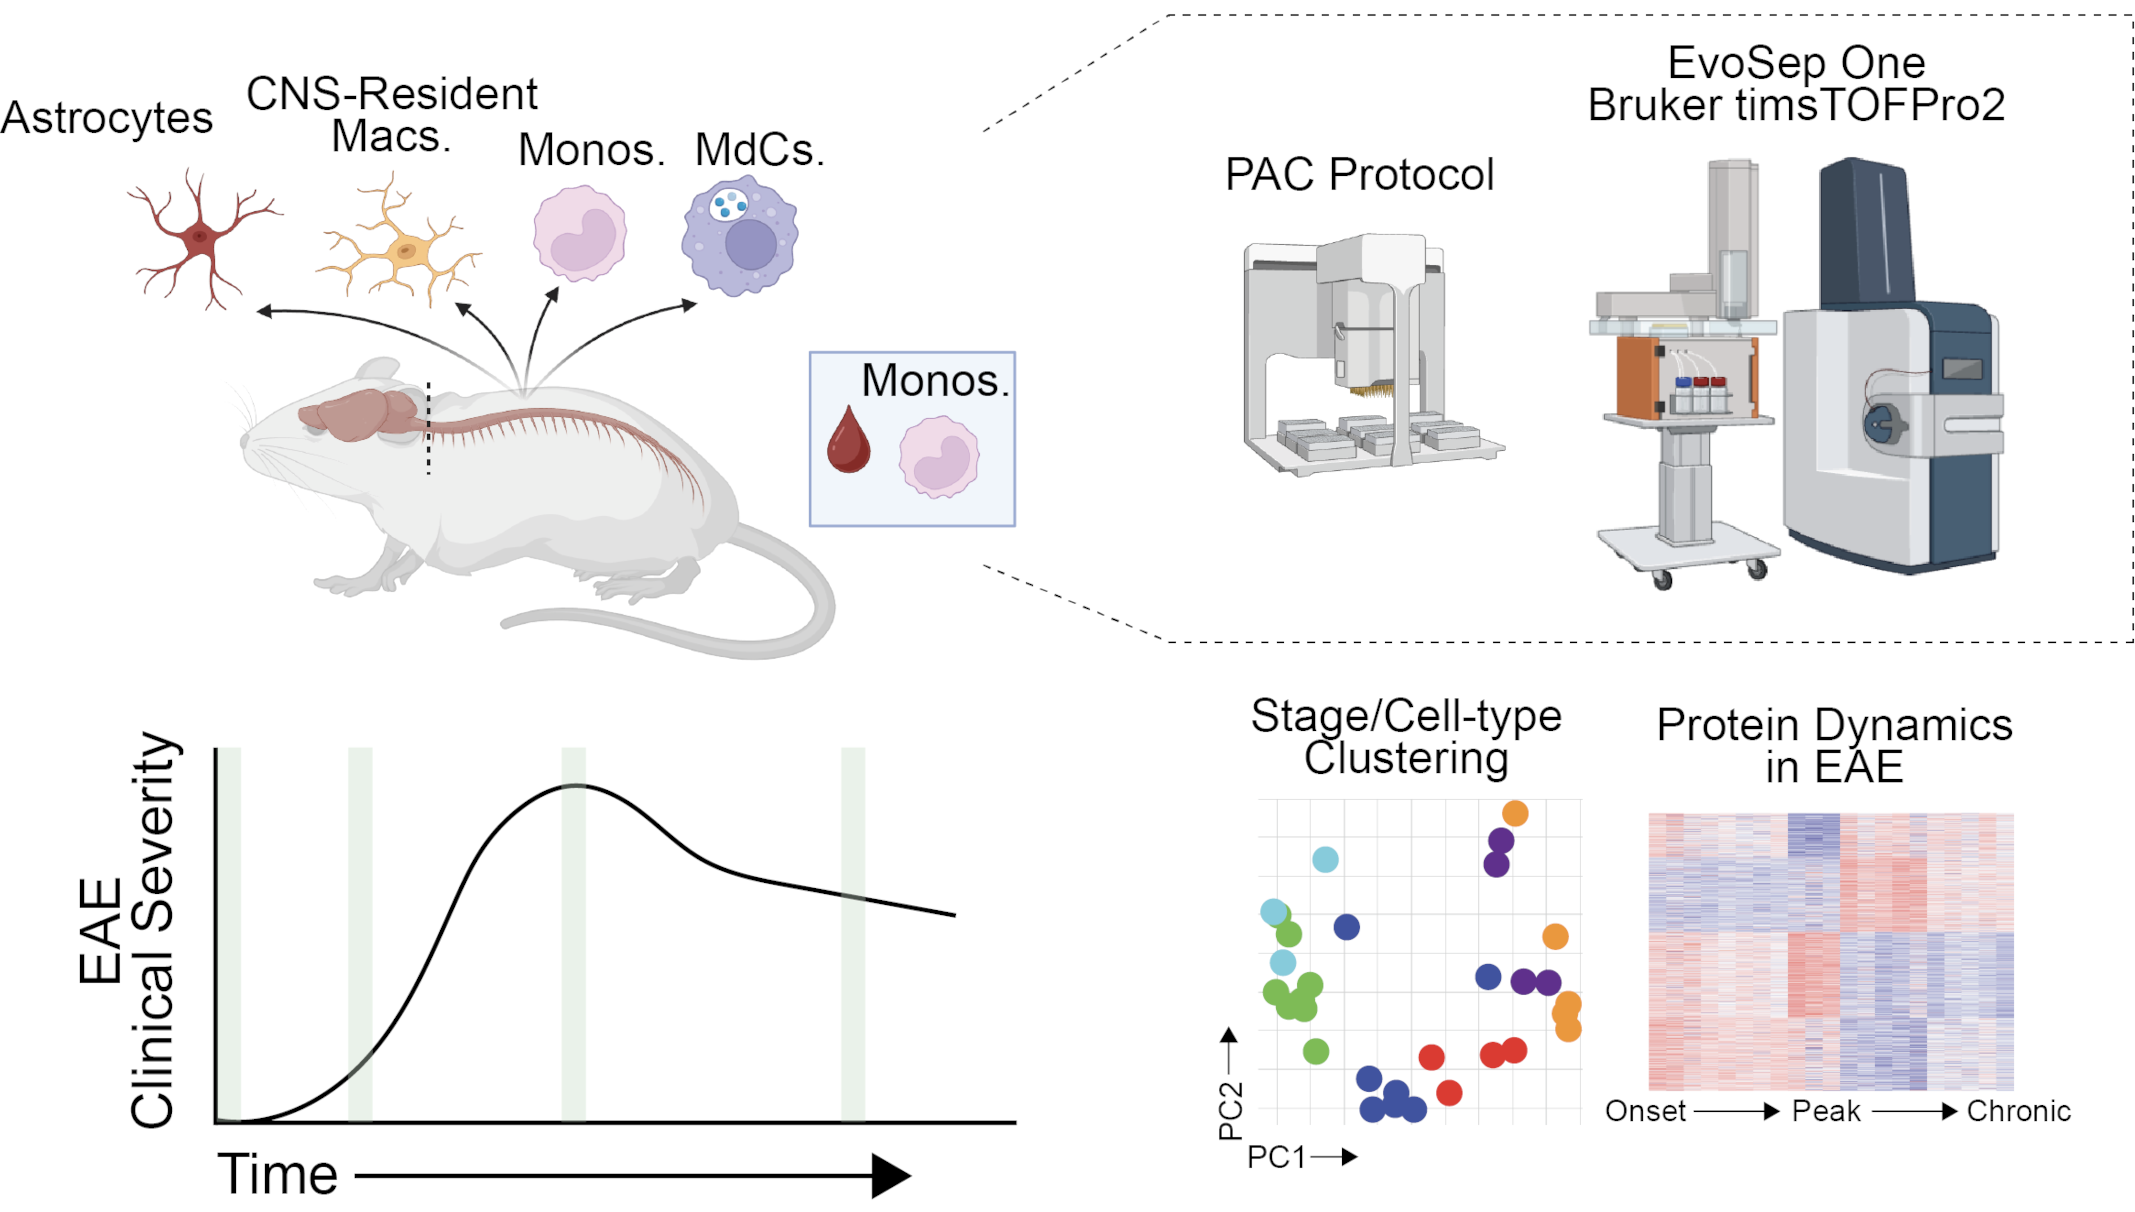
This plot shows the Principal Component Analysis (PCA) for protein expression data for the following cell-types across the following disease stages:
- Ly6Chi Monos. Blood: Circulating Ly6Chi monocytes isolated from blood
- Ly6Chi Monos. Spinal Cord: Ly6Chi monocytes isolated from spinal cord
- Spinal Cord Astrocytes: Astrocytes isolated from spinal cord (see Fig. 4e, p. 26)
- MdC: Microglia from infiltrating monocyte-derived cells
- Microglia
- Ly6Chi Blood vs. Ly6Chi Spinal Cord: Comparison between circulating Ly6Chi monocytes isolated from blood and from Ly6Chi monocytes isolated from spinal cord (see Fig. 1a, p. 32)
- Microglia vs. MdCs: Comparison between Microglia and Monocyte Derived Cells (MdCs), both isolated from spinal cord (see Fig. 3a, p. 30)
- Naive: Naïve stage
- Onset: Symptom onset
- Peak: Symptom peak
- Chronic: Long-term chronic phase
In contrast to the paper, in which PCA was performed using the Perseus software,
PCA was calculated here using the R function prcomp,
which is based on singular value decomposition. The log-transformated data
were therefore z-score scaled.